We use critical Casimir forces to induce well-defined attraction between colloidal particles. This allows us to condense colloidal particles from a gas into a liquid phase, and from liquid into crystal phases with excellent temperature control. The movie above shows the nucleation of a colloidal liquid from a colloidal gas upon approaching the critical temperature of the solvent, giving rise to increasing critical Casimir interactions between the particles, see below. See paper in Nature Comm.
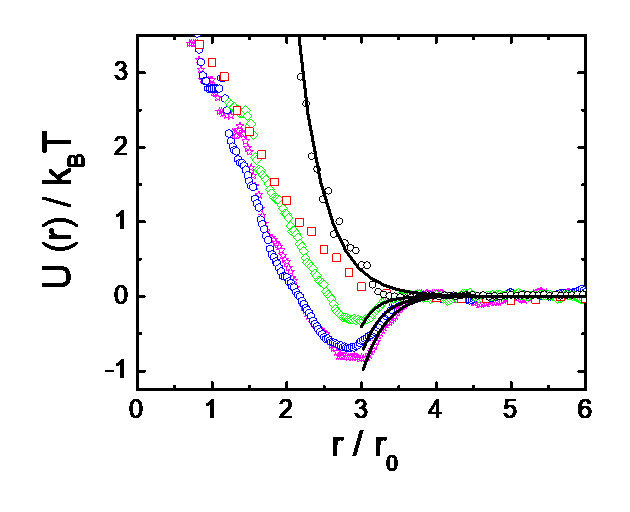
The attractive critical Casimir interaction between the colloidal particles are mediated by the solvent: they arise close to the solvent critical point from the confinement of solvent (concentration) fluctuations between the particle surfaces, analogous to the quantum-mechanical Casimir force that arises from the confinement of vacuum fluctuations of the electromagnetic field. Because these solvent fluctuations obey well-known universal scaling relations with temperature, temperature provides a unique control parameter of the interaction range and magnitude. Experimentally determined particle pair potentials at a few temperature distances dT to the critical temperature Tc are shown on the left. Upon approaching the solvent critical point, the attractive minimum deepens.
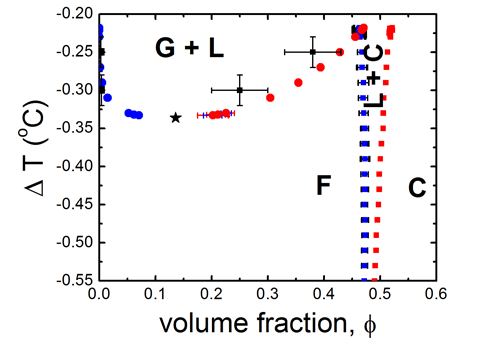
To map the coexistence regions of colloidal gas (G), liquid (L) and crystal (C), we compute the phase diagram using Monte Carlo simulations, taking the measured pair potentials from above as input. The resulting phase diagram on the left shows the coexistence of gas, liquid and crystal phases. Particle condensation occurs upon increasing the temperature towards Tc. The computed phase diagram shows good agreement with the experimentally measured occurrence of phases (black symbols and error bars).