We use granular materials every day: we build sand castles at the beach, sprinkle salt into the soup, and let granola flow into our bowl to make muesli. When walking at the beach, you notice a peculiar property of this particulate matter: you can gently sink in, but when compressed, the sand can carry your weight. When jogging at the beach, you notice another property: jogging is quite an effort, due to the large amount of dissipation associated with sand upon compression or shear.
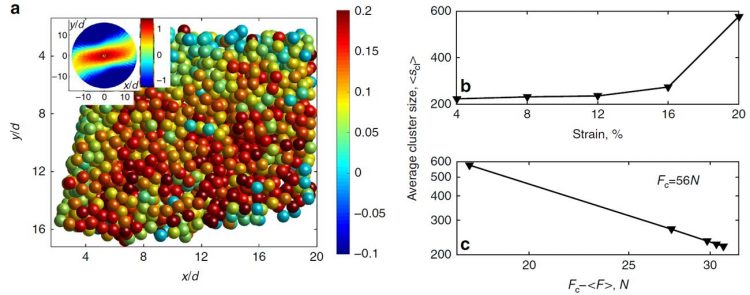
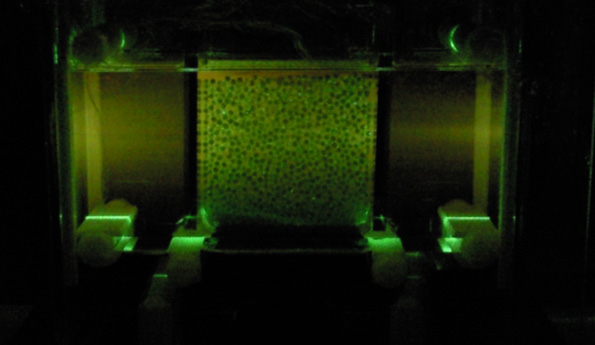
We investigate the interplay of rigidity induced by compression and flow induced by shear of a granular material. To do so, we confine several ten thousand tiny plastic spheres in a small container and subject them to controlled compression by a top plate with adjustable weight, and to applied shear by tilt-able side walls. During shear, built-in pressure sensors record the “noise” produced by the flowing sand. Analyzing this noise reveals that the emitted sound is actually everything else than “white noise”: We find a highly correlated signal that witnesses correlated “avalanches” taking place in the compressed, flowing sand. To visualize these correlated avalanches, we use a laser sheet, allowing us to image the individual particles in three dimensions, and to track their motion over time. The picture above shows a slice through the model granular system illuminated by a green laser, broadened into a thin “sheet” of light. By scanning this sheet across the sample, we obtain a three-dimensional image of the granular sample. Taking many of these image stacks over time, we follow the motion of the individual particles, allowing us to reconstruct the distribution of avalanches. Read our paper in Nature Communications
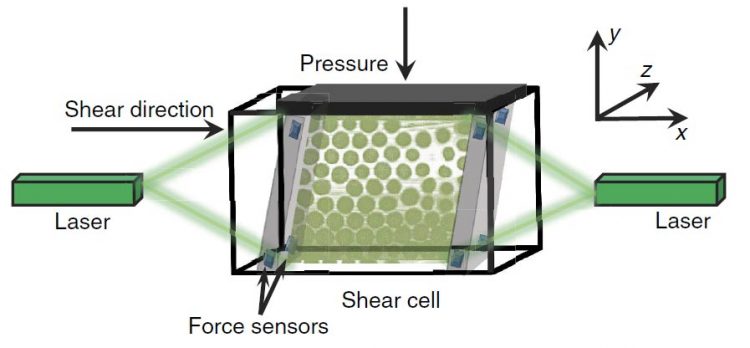
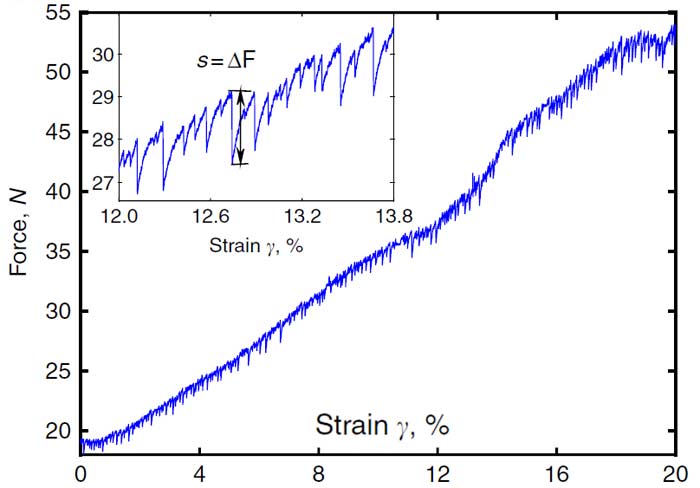
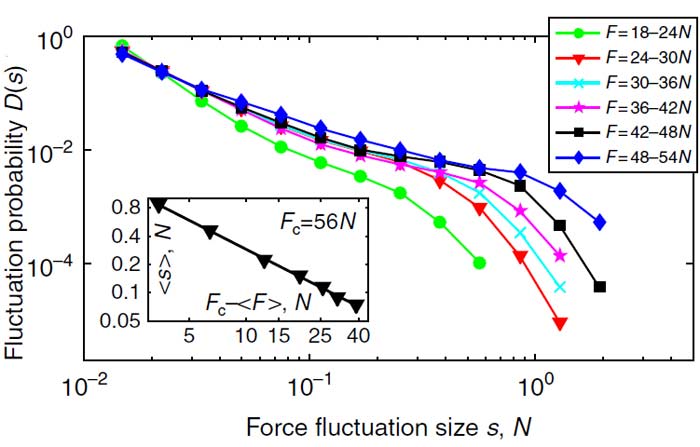
Figure 2: Force fluctuations upon loading (shearing) the granular system. Left: Raw data. Recorded force as a function of shear strain. Many small force drops are observed, the magnitude of which is defined in the inset. Every force drop is due to an avalanche of rearranging grains. Right: Distribution of force drop magnitudes. A power law distribution with an exponential cutoff is observed. This cutoff moves to the right as we approach the yield point of the system, where it starts to flow entirely.